July 2025
Assessing the Safety of Piped Water in Kabarole
Survey from February 2025
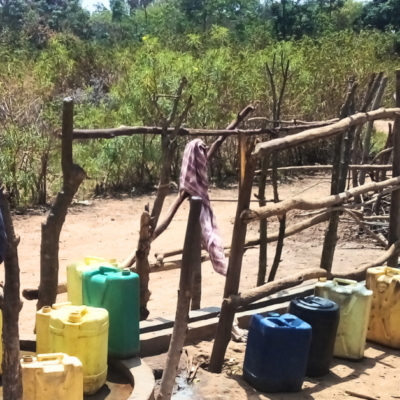
Kabarole District is located in Western Uganda and is part of the Tooro Kingdom. Its former main town, Fort Portal, became a city in 2020, leaving Kabarole with one county (Burahya).
WaterTRACS has been coordinating longitudinal water quality monitoring in two target districts in Uganda since 2022. In February 2025, Aquaya conducted a sixth round of surveys and water quality testing at households, water points, schools, and healthcare facilities in Kabarole District. This effort builds upon prior monitoring.
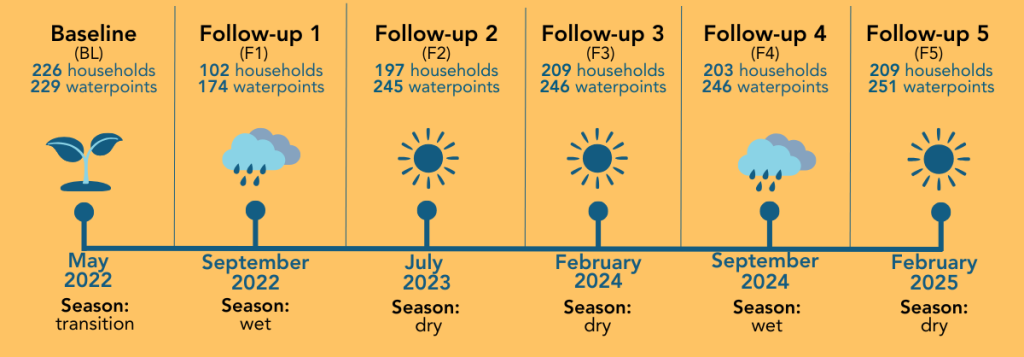
Timeline of drinking water samples tested in Kabarole District, Uganda
Background
This research brief focuses on piped water systems, which are the most common source of drinking water in Kabarole, used by 38% of households in February 2025 (F5). This rate has remained steady since 2022. Residents in Fort Portal City reported higher usage (61%) compared to those in Kabarole District (14%).
Nearly half of schools (38%–57%) and two-thirds of healthcare facilities (55%–75%) in the district relied on piped water throughout the study period.
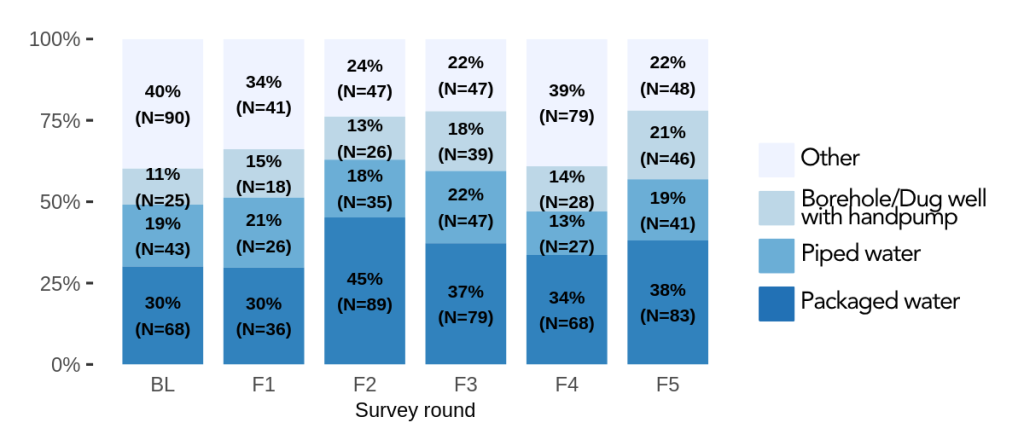
Current drinking water sources of surveyed households at each sampling time in Kabarole (including both Fort Portal City and Kabarole District), including piped water, boreholes and dug wells with handpumps, protected springs, and other source types.
Results
Piped water service reliability
Across all study visits, only two-thirds of piped taps had water available. Availability peaked in early 2022, when 81% of taps were working, but dropped to 54% by February 2025. Respondents frequently cited closures or caretaker absences as reasons for unavailable taps. In about half the cases, waterpoints lacked water either because someone shut them off or caretakers were not present.
Microbial water quality
We found E. coli contamination has been present in about three-quarters of piped water supplies across all study visits since 2022. When comparing to other source types, boreholes with handpumps and protected springs have consistently had less E. coli present than piped water. In early 2025 (F5), 63% of piped samples from taps had E. coli (n=54).
Chlorination
Free chlorine helps prevent microbial contamination. However, we found that only 17% to 39% of tap samples across the surveys met the national minimum chlorine standard of 0.2 mg/L.
In February 2025, about 54% of tap samples had detectable total chlorine. But just 17% met the minimum free chlorine requirement. Only 5% of samples met the World Health Organization’s recommended 0.5 mg/L level for water that is stored before use.
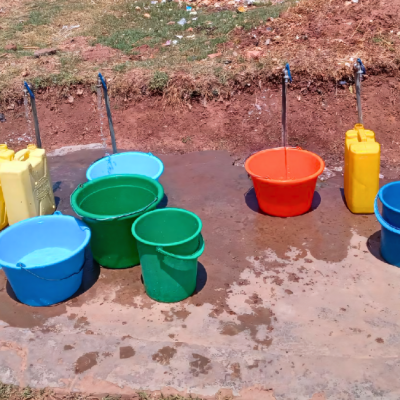
On-plot piped water and household storage
Across all sampling times, nearly a quarter of households (22%) had an on-plot piped water connection and reported that as their current drinking water source (n=1,348). In contrast, only 7% of households reported drinking water from an off-plot piped source.
Nearly all households that drank from on-plot taps (97%, n=327) also stored their drinking water at home.
Recommendations
- Piped water service reliability and climate resilience should be improved such that water service is provided more regularly throughout dry periods.
- All piped water supplies should be chlorinated.
- Chlorination should be performed more consistently and at higher levels to ensure a free chlorine residual stays above 0.2 mg/L throughout the piped network.
Learn more about our water quality results in
WaterTRACS is supported by funding from the Conrad N. Hilton Foundation.